Air Analyzer v2.0.3
Introduction
This project was born to improve the humidity of my room, after I found out that I have the allergy to dust mites.
Dust mites thrive in temperatures of 68 to 77 degrees Fahrenheit (20 to 25 degrees Celsius). They also like humidity levels of 70 to 80 percent.
The main idea was of my cousin, Marco Palladino. In my case, I have needed a system for doing Data Analysis about my room and others. Moreover, with this project I wanted to improve my knowledge about the System and Integration, User-Centered Interface and Mobile Development, especially for Android.
Files
Here to download the files for Device and Android smartphone.
| Name | Type | Size |
|---|---|---|
| Device | .bin | 343 kB |
| Android | .apk | 3,3 MB |
Device
Every device has an ID (from 1 to 9, that can change with a short press of button) to indicate the room where the measures will be read and stored into external database, every 10 minutes.
The connection happens with WiFi, that can be set during and after the first installation. In first case, the user must set the own UTC timezone for storing the time along with the measures. In second case, the user must push the button for 3 seconds to start the WPS connection. Morover, I have needed an OLED screen to visualize the actual values, the status of connection and the ID of the room set. To solder the components I deiced to use a mastrix board instead an homemade PCB like in LED Controller v1.0.0.
The first version used a NTP Server to check the time; with one device there were not problems, but with several devices the server refused the connection in same (or nearly) time. This is right! To solve it, I decided to use a DS3231. The NTP is used only on first installation, or on battery change of DS3231.
About the classes, for this project I decided to implement the Observer pattern.
The observer pattern is a software design pattern in which an object, named the subject, maintains a list of its dependents, called observers, and notifies them automatically of any state changes, usually by calling one of their methods.
The sensor class is the subject; the LCD and database class are the observers notified from sensor class. Because the HDC1080 is very sensitive, is set a timeout of 1 second into check’s method of sensor class. Also, the database is not updated on every new measure but after 10 minutes.
To build it
Since I decided to use a matrix board instead a PCB, there is not a circuit diagram. Anyway, in this part of this post I show you the components used, the wiring and the flashing of firmware.
Components
| Qty. | Component |
|---|---|
| 1 | NodeMCU V3 based on ESP8266 |
| 1 | I2C OLED Screen (128×32, 0.91 inch) |
| 1 | I2C HDC1080 |
| 1 | I2C DS3231 |
| 1 | Switch Tact at 6x6x5mm |
Wiring
In this table I want to show you the right connection of components, to work with the firmware that I prepared.
| PIN board | PIN component |
|---|---|
| D1 | SCL of LCD, HDC1080 and DS3231 |
| D2 | SDA of LCD, HDC1080 and DS3231 |
| D5 | Switch Tact |
| 3V3 | Positive terminal of LCD, HDC1080 and DS3231 |
| GND | Negative terminal of Switch Tact, LCD, HDC1080 and DS3231 |
WARNING: The other pin of Switch Tact will have to connect directly to ground, without resistor. This is beacuse is used the built-in pullup resistor.
The little DS3231 that I suggested has the labels hidden. To help you about the wiring, consider this image found on Google Image.
Flash firmware
To flash the firmware, you will have to install the Flash Download Tool and following this steps:
- select Developer Mode;
- select ESP8266 DownloadTool;
- configure it as in figure;
- press Start.
Is very important select the location of .bin file and set the address to 0x00000 and select the right COM port.
After the flashing of firmware, unplug and plug the device to power supply. For the first installation of device, you will have to need a mobile application developed for Android smartphone. Every device has the need to store the values into user database, different from others.
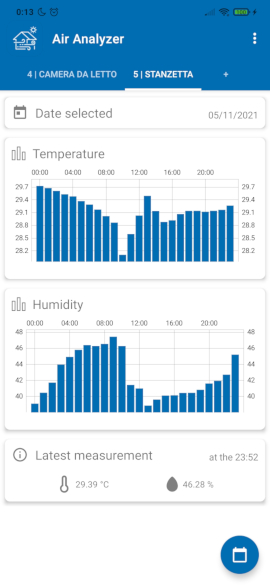
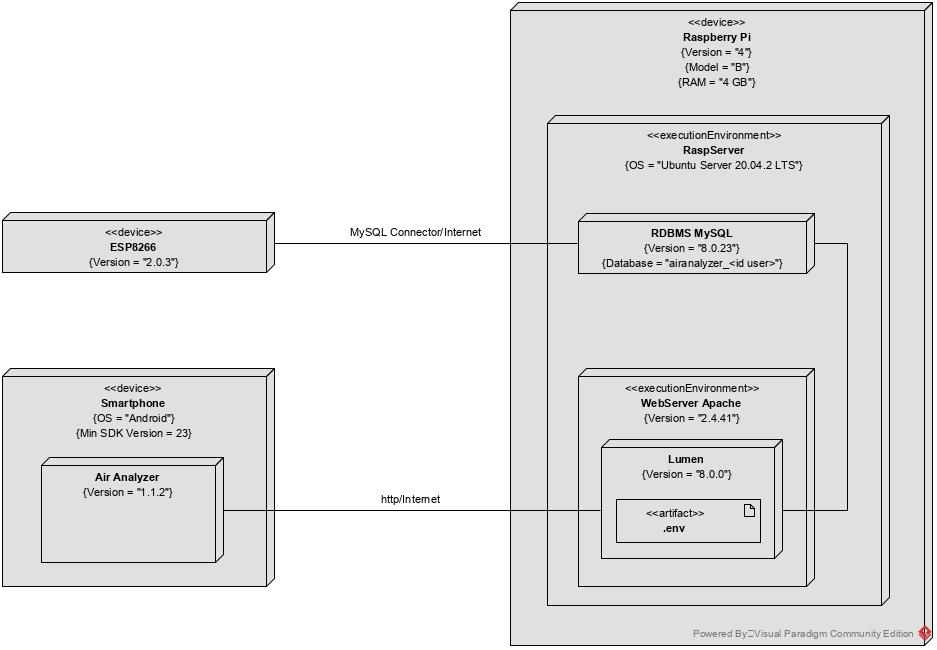
Mobile application
Looking the details, this mobile application was born firstly to view the measures outside home. Considering that Android doesn’t communicate directly with an external database, I have chosen to use Lumen as API framework. In this case, thanks to the App, I implemented a system where an user can:
- sign up and login;
- add new device;
- add, rename or delete a specific room;
- view the measures on specific day.
As mentioned before, every user has the own database where can see the measures also with external and desktop application like KNIME.
Conclusion
Thank you for reading this article and if you have some suggestion, write me at davidepalladino@hotmail.com.